
Investment Guides
Which Areas Near Gurgaon Will Appreciate the Most? What Data Shows
No data can say for sure which area near Gurgaon will rise most, and our signals point different ways. The Dwarka Expressway and SPR rose fastest from 2020 to 2025 and SPR has the steepest base-case path to 2030, while collector rates for plots rose most in Wazirabad, Badshahpur and Harsaru.
 By Mridul Shakya · Edited by
Rakesh Mahajan · · 9 min read
Which areas near Gurgaon will appreciate the most?
Nobody can tell you for sure, and anyone who promises it is guessing. What our data can show is four signals: past price growth, the latest yearly change, official land-value revisions and new supply. On those, SPR and the Dwarka Expressway look strongest on prices. Collector rates for plots rose most in Wazirabad, Badshahpur and Harsaru.
The signals don't all point the same way, and that's the useful part. This guide puts them side by side so you can see where they agree and where they don't. It covers the six Gurgaon localities we track. For the wider region, including the Yamuna Expressway and Noida, see our guide to emerging property markets in NCR.
Which Gurgaon areas rose fastest from 2020 to 2025?
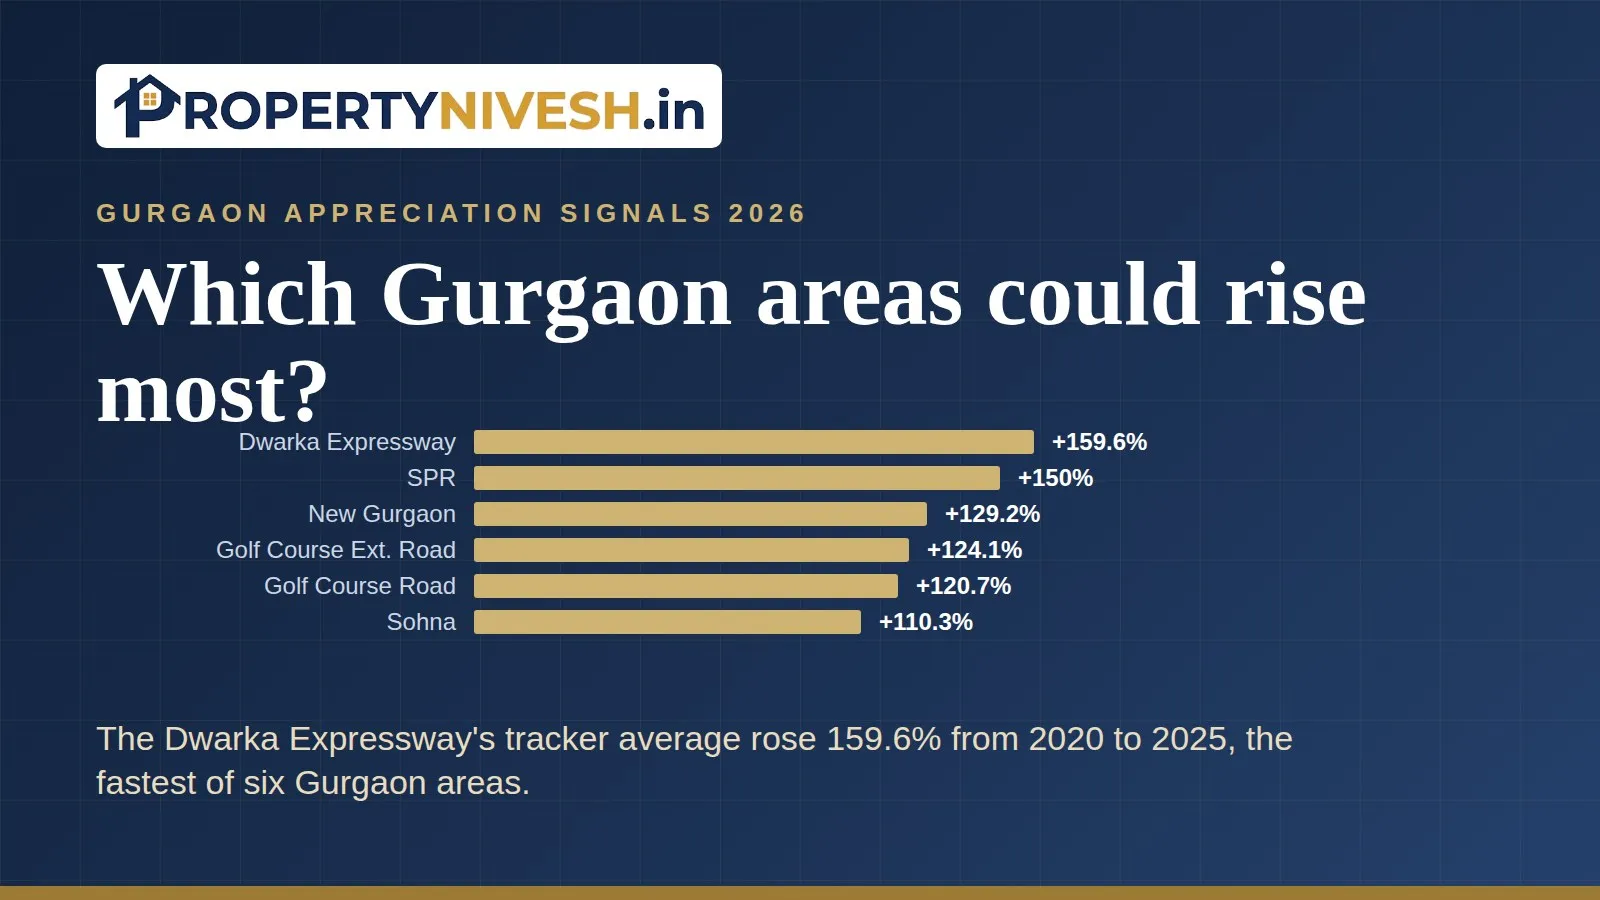
The Dwarka Expressway and SPR, by percentage. Dwarka Expressway's tracker average rose 159.6% from 2020 to 2025, and SPR's rose 150%. Sohna rose the least, at 110.3%, though that's still more than double.
| Locality | 2020 (₹ per sq ft) | 2025 (₹ per sq ft) | Change 2020 to 2025 | Average a year | 2025 change | 2030 range, low to high (₹ per sq ft) |
|---|---|---|---|---|---|---|
| Dwarka Expressway | 5,200 | 13,500 | +159.6% | 21% | 8% | 16,000 to 19,800 |
| Southern Peripheral Road (SPR) | 6,200 | 15,500 | +150% | 20.1% | 9.2% | 18,500 to 24,000 |
| New Gurgaon (Sectors 76 to 95) | 4,800 | 11,000 | +129.2% | 18% | 7.8% | 13,000 to 16,000 |
| Golf Course Extension Road | 8,700 | 19,500 | +124.1% | 17.5% | 8.3% | 23,100 to 29,100 |
| Golf Course Road | 14,500 | 32,000 | +120.7% | 17.2% | 8.5% | 38,000 to 48,100 |
| Sohna (South Gurgaon) | 3,900 | 8,200 | +110.3% | 16% | 6.5% | 9,600 to 11,200 |
The chart shows the average yearly change from 2020 to 2025 for each NCR locality we track.
These figures come from our price tracker. Each is the average asking price per sq ft across the projects and listings we track in that area, mostly flats. Plots are priced per gaj (1 gaj is 1 square yard, or 9 sq ft), so treat flat prices as a direction guide for land.
Percentages flatter cheaper areas. In rupees, Golf Course Road gained the most: ₹17,500 per sq ft (32,000 minus 14,500). SPR gained ₹9,300 (15,500 minus 6,200) and Sohna ₹4,300 (8,200 minus 3,900). Which number matters depends on your budget and whether you care about returns in rupees or in percent.
Does the 2030 forecast pick a winner near Gurgaon?
Not really. In our base case every tracked locality ends 2030 about 35% to 42% above its 2025 level. SPR is at the top, about 42% (22,000 / 15,500 = 1.42), and Sohna is at the bottom, about 35% (11,100 / 8,200 = 1.35).
That narrow spread comes from the method. Growth starts at each area's 2025 change and eases in equal steps to a long-run pace of 6.1% a year by year five. The 6.1% comes from NHB press releases. It's the average yearly rise in the National Housing Bank's RESIDEX 50-city index over the eight quarters from Q3 2024 to Q2 2026. The low case is half the base-case growth. The high case holds the faster of the starting and long-run pace for five years.
Because all six areas slowed to between 6.5% and 9.2% in 2025, they all start close together. It's a projection, not investment advice, and it can't see roads, rates or supply. Our Gurgaon price prediction for 2030 has the full year-by-year table.
What do collector rate changes say about land near Gurgaon?
They show where the government has raised official land values fastest. A collector rate is the minimum value Haryana sets for registering a property, area by area. It isn't a market price, but stamp duty is charged on the price or the collector value, whichever is higher. Each tehsil, a revenue area, has its own list.
| Tehsil | Plots, latest list (2025-26 to 2026-27) | Lines | Plots, two lists (2024-25 to 2026-27) | Lines |
|---|---|---|---|---|
| Wazirabad | +45% | 88 | +74% | 52 |
| Badshahpur | +25% | 51 | +32.1% | 28 |
| Harsaru | +25% | 32 | +37.5% | 15 |
| Gurugram | +15% | 134 | +46.7% | 16 |
| Kadipur | +15% | 51 | +40.9% | 26 |
| Manesar | +0.7% | 60 | +10.9% | 40 |
| Sohna | +0.1% | 84 | +10.1% | 60 |
The chart shows the median change in residential-plot collector rates by tehsil in the latest list. Each median is across the lines listed in both years, and the line counts are in the table.
Wazirabad stands out, with plot lines up a median 45% in one year and 74% over two. Harsaru, which covers Sectors 88 to 95 and villages such as Harsaru and Budhera, rose 25%. Manesar and Sohna barely moved for plots in the latest list, at 0.7% and 0.1%.
Two tehsils have their own lists. In the 2026-27 list, Pataudi's agricultural lines rose a median 60% (95 lines) and Farrukhnagar's 30% (99 lines). Their residential lines barely moved: 1% in Pataudi (102 lines) and 0% in Farrukhnagar (48 lines). These are the official percentage changes printed in that list. We hold no price series for Pataudi, Farrukhnagar or Manesar. For Manesar, see our post on Manesar's appreciation potential, and for land further out, our comparison of Farrukhnagar and Pataudi.
A word of caution. Collector rates often catch up with deals that already happened, so a big jump can describe the past rather than predict the future.
Where is new housing supply coming up near Gurgaon?
Mostly in New Gurgaon and along the Dwarka Expressway. HRERA, the Haryana Real Estate Regulatory Authority, registers projects before they can be sold. Since 2021 its Gurugram records list 120 projects in Sectors 88 to 95 and 101 in Sectors 99 to 115, the two biggest groups.
The chart counts HRERA registrations since 2021 by corridor. Records run to 14 September 2026, so 2026 is a part year.
Next come Central Gurugram (Sectors 1 to 57) with 95 and Sectors 76 to 87 with 81. Golf Course Extension Road has 79, Sohna 51 and SPR 42. A registration isn't a quality rating. It means a project was filed and approved for sale.
Supply cuts both ways. Lots of new projects show that developers expect demand there. They also mean more choice for buyers and more competition on price, which can slow resale gains. Our post on which Gurgaon sectors will develop in the next five years goes sector by sector.
How do the signals line up for each Gurgaon area?
No area leads on everything. SPR comes closest, with the fastest 2025 rise and fairly light supply. New Gurgaon and the Dwarka Expressway have strong price histories but the most new projects competing for buyers.
| Area | 2025 price change | Flat collector line, latest list | HRERA projects since 2021 | What stands out |
|---|---|---|---|---|
| SPR | 9.2% | +9.1% (Kadipur line for Sectors 71 to 75A) | 42 | Fastest 2025 rise, least new supply counted here |
| Golf Course Road | 8.5% | No line in our extraction names its sectors | Inside our Central Gurugram group (95) | Biggest rupee gains, highest entry price |
| Golf Course Extension Road | 8.3% | +10.3% (Badshahpur line for Sectors 63, 63A, 64, 67, 67A, 68, 75, 76 and 78) | 79 | Steady on every signal |
| Dwarka Expressway | 8% | +9.1% (Kadipur line from Sector 99); +8.3% (Sectors 37C, 37D) | 101, plus 27 in Sectors 36A to 37D | Fastest five-year rise, heavy supply |
| New Gurgaon | 7.8% | +7.7% (Harsaru, Sectors 88 to 95); +10% (Manesar, most of 76 to 87) | 201 (81 plus 120) | Most new supply of any area |
| Sohna | 6.5% | No flat line; plots +0.1% (tehsil median) | 51 | Slowest on prices, lowest entry price |
The collector column uses flat lines that name each area's sectors, from the 2026-27 list. Golf Course Road projects such as Godrej Sora in Sector 53 fall inside our Central Gurugram HRERA group, so we can't split its supply out.
Read the table as a set of questions, not answers. Fast past growth tells you an area was re-rated. A high starting pace tells you momentum hasn't faded yet. Heavy supply tells you to bargain hard and check delivery records.
What could go wrong with these appreciation signals?
Each signal can mislead on its own. Here's what to keep in mind.
- Past growth rarely repeats. Prices rose more than 20% a year in all six areas in 2022 and 2023. Then every one of them slowed sharply in 2025.
- Supply can pile up. ET Realty, citing Knight Frank India, reported in October 2026 that Gurugram holds 57% of NCR's unsold homes.
- Loans got dearer. The Reserve Bank of India raised its repo rate to 5.50% in October 2026, ET Realty reported.
- Projects slip. The SPR elevated road was re-tendered in October 2026, and the Delhi-Gurugram Namo Bharat line (part of the RRTS regional rapid rail network) still has no Union government sanction in our records.
- Builders fail. The Tribune reported on 30 September 2026 that Gurugram moved against 71 builders owing ₹486 crore in RERA dues.
What should you check before picking an area near Gurgaon?
- Match the signal to your plan. If you'll live in the home, daily access and water matter more than a forecast.
- Check the project, not just the area. Look up its HRERA registration, status and possession date, and whether it has lapsed.
- Check the land papers for plots. Ask for the DTCP licence, the Town and Country Planning Department's licence for a colony, and the collector rate for that exact line.
- Price in the costs. Haryana stamp duty is 7% for men and 5% for women, on the price or the collector value, whichever is higher.
- Bargain where supply is heavy. Compare several projects in the same sector before paying a token amount.
To test a growth assumption, use our property appreciation calculator, and see current averages for each locality on our Gurgaon property rates page.
Questions
Frequently Asked Questions
Which area near Gurgaon has grown the most in price? +
In percentage terms, the Dwarka Expressway. Its tracker average rose 159.6% from 2020 to 2025, from ₹5,200 to ₹13,500 per sq ft. SPR was next at 150%. In rupees, Golf Course Road gained most, ₹17,500 per sq ft, because it started from a much higher base. Past growth doesn't guarantee future gains.
Which Gurgaon locality has the highest 2030 forecast growth? +
SPR, in our base case. It ends 2030 at about ₹22,000 per sq ft, roughly 42% above its 2025 level of ₹15,500, because it had the fastest 2025 rise at 9.2%. The other five tracked areas land between about 35% and 40%. It's a projection from a fixed formula, not advice.
Where did collector rates rise the most near Gurgaon? +
For residential plots in the latest list, Wazirabad tehsil, with a median rise of 45% across 88 lines. Badshahpur and Harsaru followed at 25%. Manesar and Sohna barely moved, at 0.7% and 0.1%. Collector rates are official minimum values for registration, not market prices, and they often lag real deals.
Does more new supply mean an area will appreciate faster? +
Not by itself. Heavy HRERA registrations show developers expect demand, but they also give buyers more choice and builders more competition, which can slow price rises. New Gurgaon has the most supply in our records, with 201 projects in Sectors 76 to 95 registered since 2021.
Do you have price forecasts for Manesar, Pataudi or Farrukhnagar? +
No. We hold no price series for Manesar, Pataudi Road, Pataudi town or Farrukhnagar, so we don't forecast them. We do have their collector-rate changes. In the 2026-27 list, Pataudi's agricultural lines rose a median 60% and Farrukhnagar's 30%, while residential lines barely moved.
Sources
- Property Nivesh price tracker, six Gurgaon localities, yearly average asking prices 2020 to 2025 and forecast to 2030, October 2026
- Property Nivesh forecast method, as printed on the Gurgaon property rates page, October 2026
- Gurugram collector-rate lists 2024-25, 2025-26 and 2026-27, median percentage changes by tehsil and line, via Property Nivesh research store, October 2026
- Farrukhnagar and Pataudi collector-rate lists 2026-27, official percentage changes, via Property Nivesh research store, October 2026
- HRERA Gurugram registered projects, 14 June 2017 to 14 September 2026, via Property Nivesh research store, October 2026
- ET Realty, NCR housing sales fall 11% to 35,574 units in Jan-Sep 2026 (Knight Frank India study), October 2026
- ET Realty, RBI repo rate rise to 5.50%, 9 October 2026
- The Tribune, Gurugram to freeze accounts of 71 builders over Rs 486 crore RERA dues, 30 September 2026
- GMDA tender notice for the SPR elevated corridor, 1 October 2026