
17 markets covered
Choose Your Market
Every city page carries average pricing, yields, growth corridors and our research desk's verdict on where the momentum is.
We cover 17 property markets — 15 in India and 2 in the UAE — with 12 locality reports underneath them. Average asking prices range from ₹5,200/sq ft in Lucknow to ₹32,000/sq ft in Mumbai. Ras Al Khaimah has grown fastest over five years (+120%), and Ras Al Khaimah offers the highest rental yield (7%). Open a city for its luxury apartments, localities, researched projects and our market analysis.
 Illustrative
 Ahmedabad
+55% / 5yGujarat
 Illustrative
 Bengaluru
+84% / 5yKarnataka
 Illustrative
 Chandigarh
+49% / 5yChandigarh (UT)
 Illustrative
 Chennai
+48% / 5yTamil Nadu
 Illustrative
 Dubai
+90% / 5yUnited Arab Emirates
 Illustrative
 Goa
+105% / 5yGoa
 Illustrative
 Greater Noida
+88% / 5yUttar Pradesh
 Illustrative
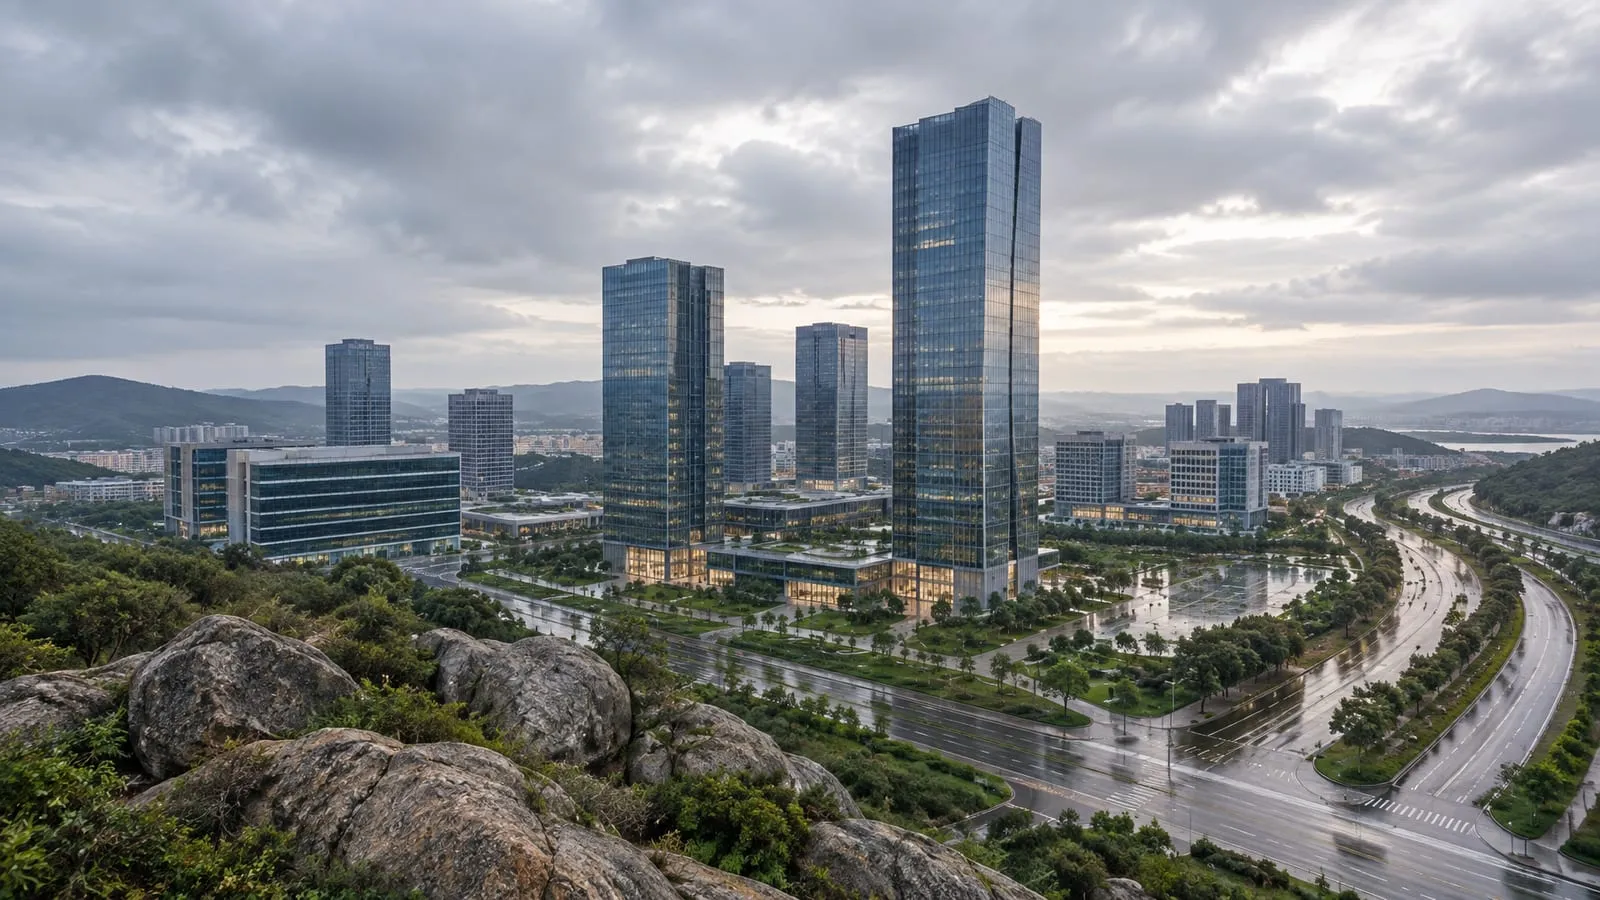
 Gurgaon
+118% / 5yHaryana
 Illustrative
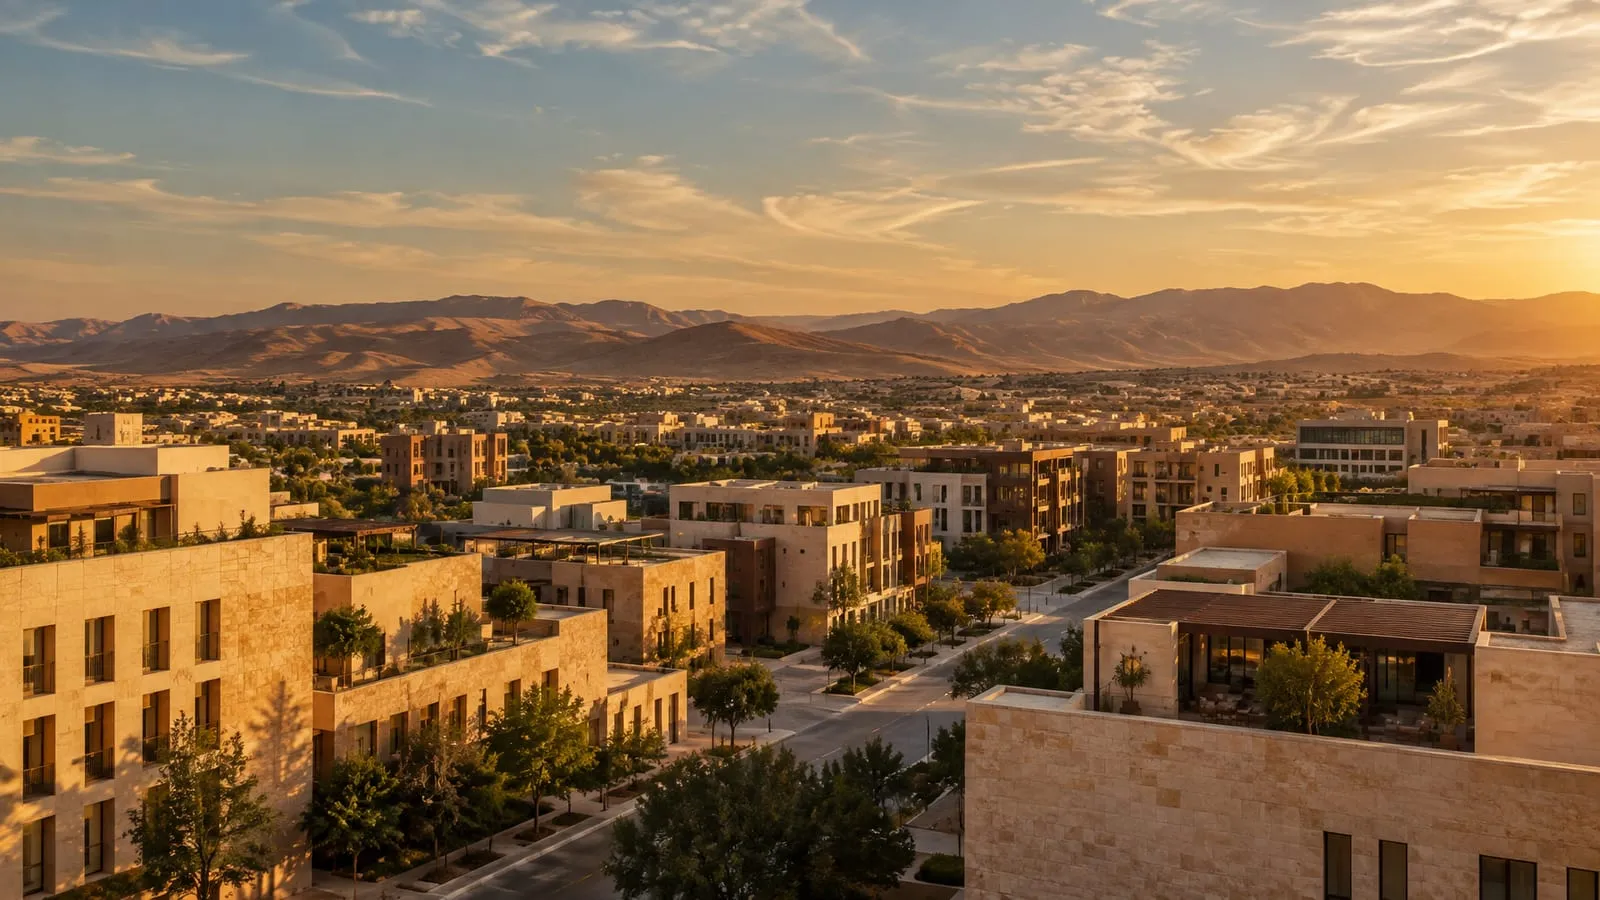
 Hyderabad
+92% / 5yTelangana
 Illustrative
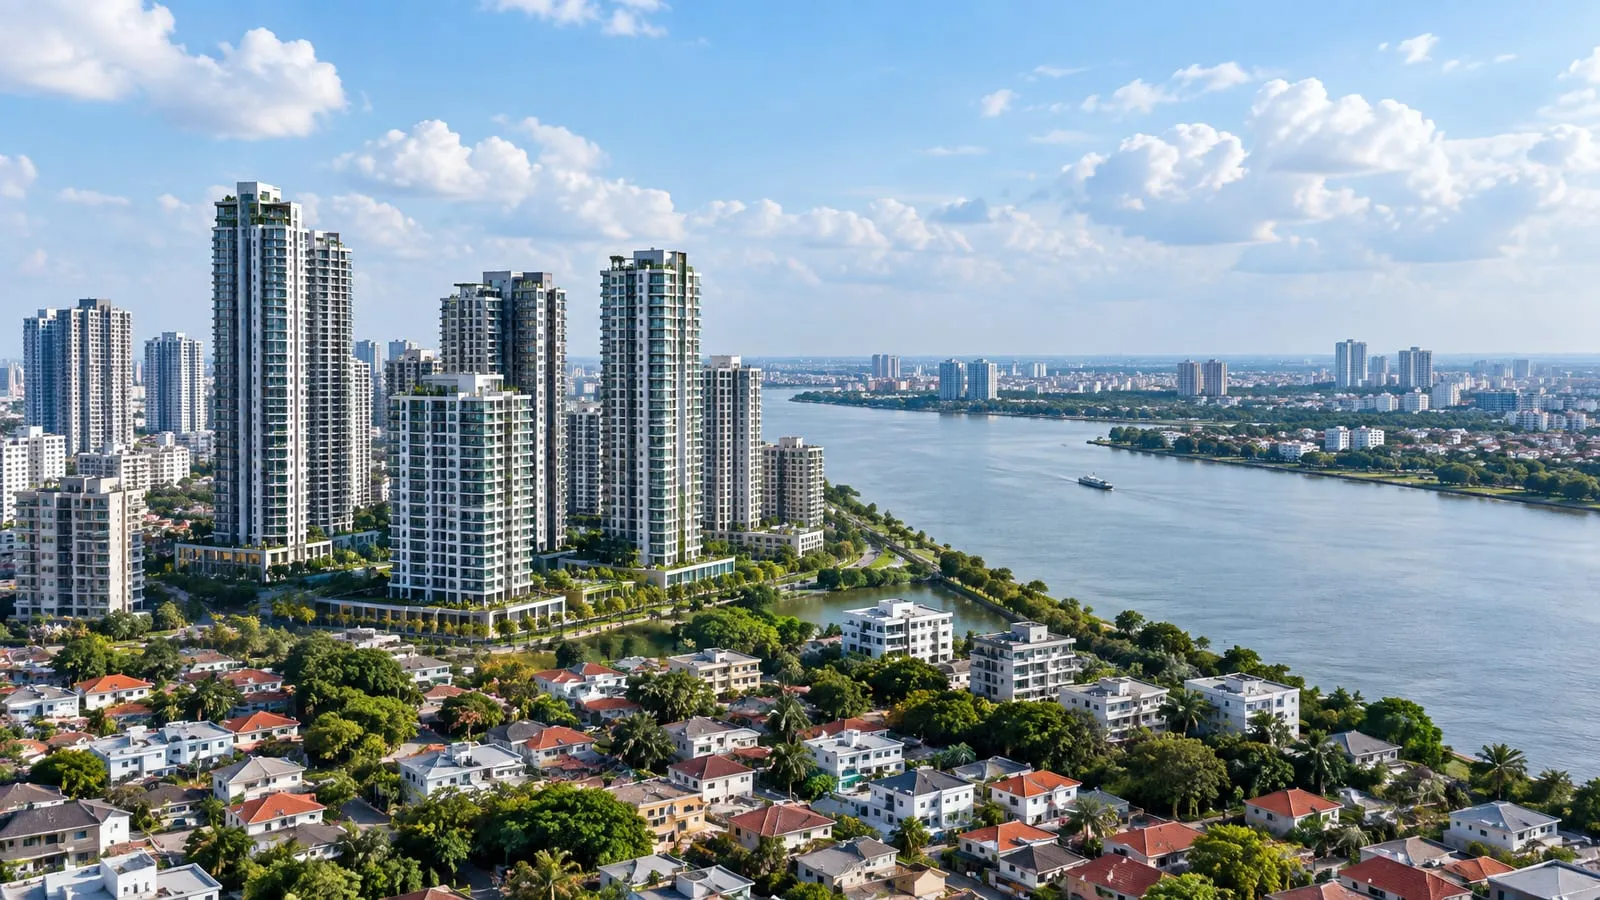
 Jaipur
+52% / 5yRajasthan
 Illustrative
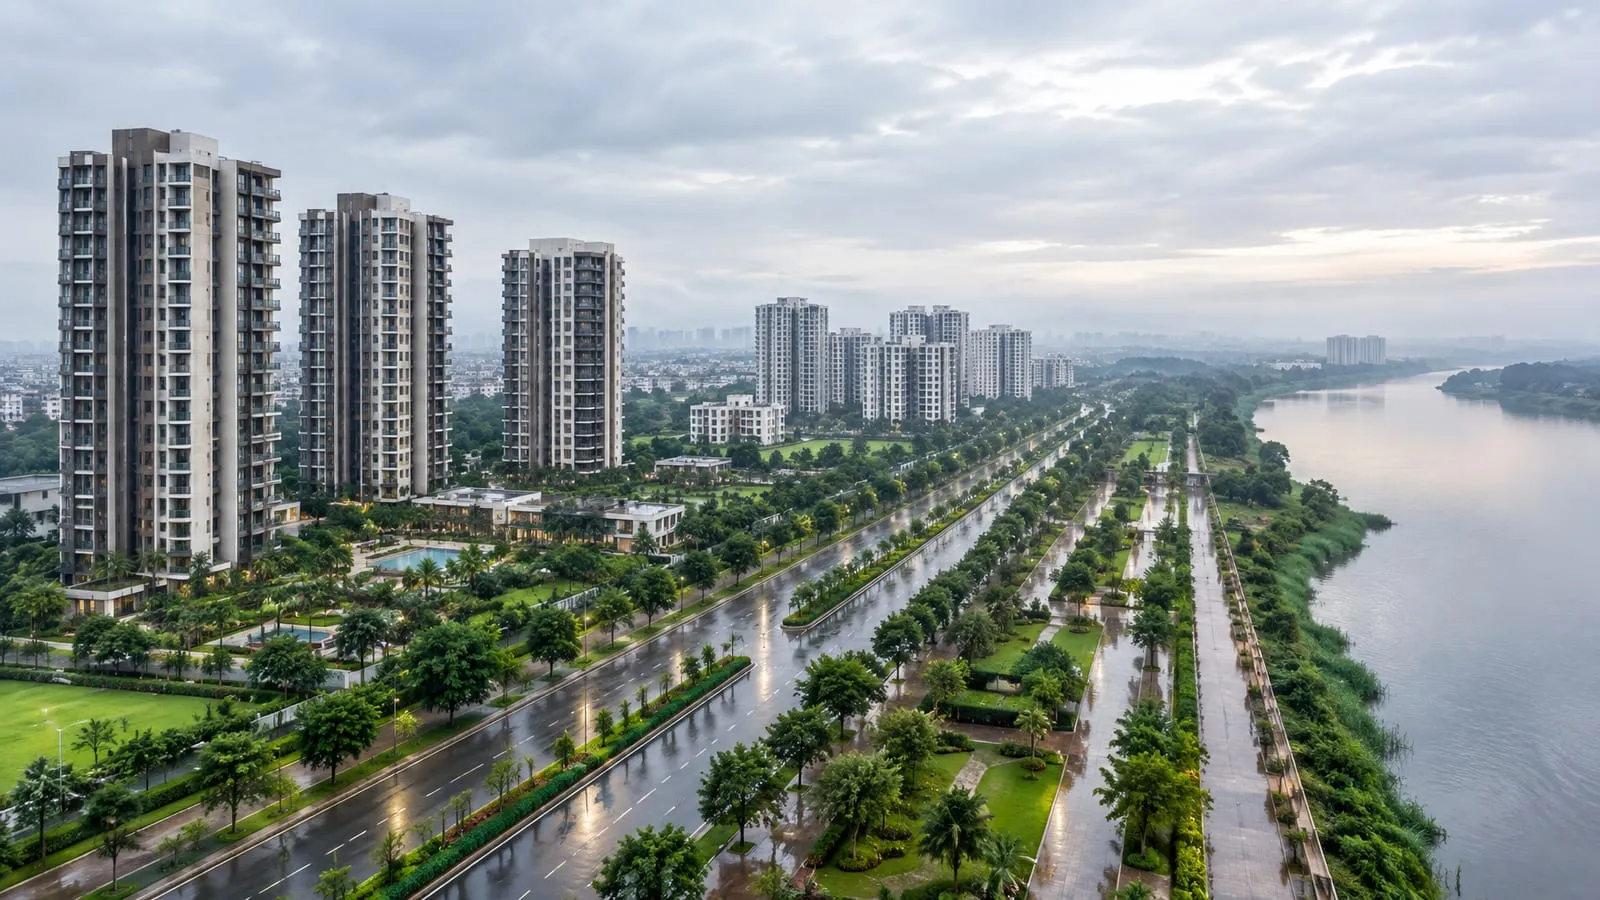
 Kolkata
+42% / 5yWest Bengal
 Illustrative
 Lucknow
+58% / 5yUttar Pradesh
 Illustrative
 Mohali
+74% / 5yPunjab
 Illustrative
 Mumbai
+62% / 5yMaharashtra
 Illustrative
 Noida
+95% / 5yUttar Pradesh
 Illustrative
 Pune
+71% / 5yMaharashtra
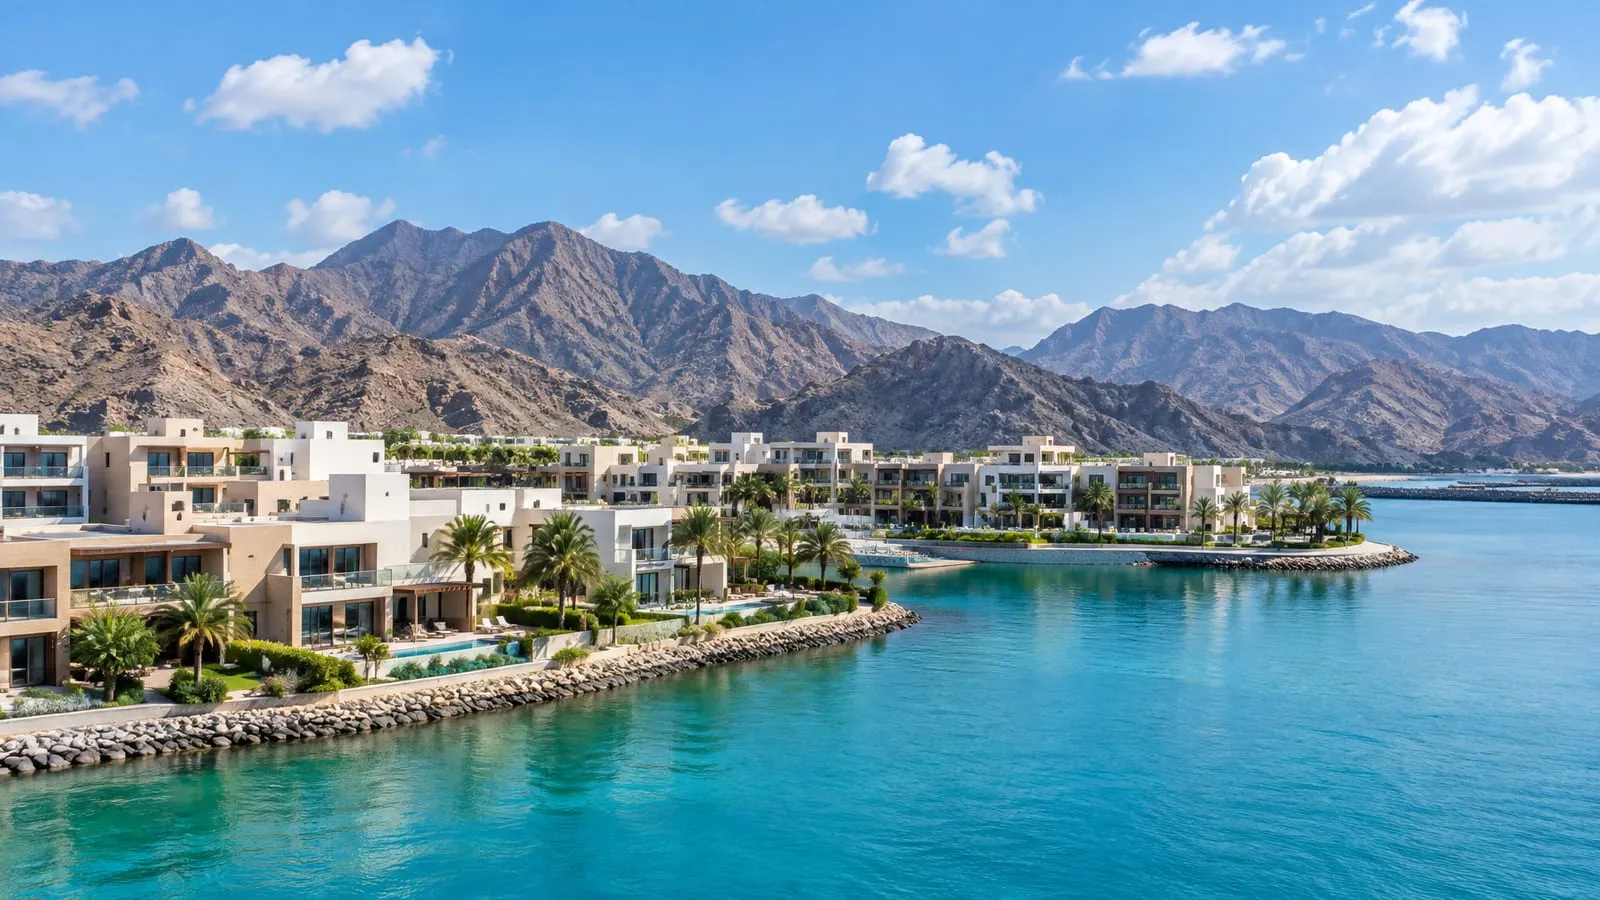 Illustrative
 Ras Al Khaimah
+120% / 5yUnited Arab Emirates
Side by side
Property Prices by City
Average asking price, five-year growth and gross rental yield for every market we cover, most expensive first.
| City | State | Average price | 5-year growth | Rental yield | Researched projects |
|---|---|---|---|---|---|
| Dubai | United Arab Emirates | ₹34,000/sq ft | +90% | 6.5% | — |
| Mumbai | Maharashtra | ₹32,000/sq ft | +62% | 2.6% | 2 |
| Ras Al Khaimah | United Arab Emirates | ₹25,000/sq ft | +120% | 7% | — |
| Gurgaon | Haryana | ₹16,500/sq ft | +118% | 3.2% | 8 |
| Goa | Goa | ₹14,500/sq ft | +105% | 4.5% | — |
| Bengaluru | Karnataka | ₹12,800/sq ft | +84% | 3.8% | 3 |
| Chandigarh | Chandigarh (UT) | ₹12,000/sq ft | +49% | 2.8% | — |
| Noida | Uttar Pradesh | ₹11,200/sq ft | +95% | 3% | — |
| Pune | Maharashtra | ₹10,500/sq ft | +71% | 3.5% | 1 |
| Hyderabad | Telangana | ₹9,800/sq ft | +92% | 3.6% | 1 |
| Chennai | Tamil Nadu | ₹9,200/sq ft | +48% | 3.3% | — |
| Greater Noida | Uttar Pradesh | ₹7,800/sq ft | +88% | 3.4% | 18 |
| Kolkata | West Bengal | ₹7,500/sq ft | +42% | 3.6% | — |
| Mohali | Punjab | ₹6,900/sq ft | +74% | 3% | — |
| Ahmedabad | Gujarat | ₹6,800/sq ft | +55% | 3.4% | — |
| Jaipur | Rajasthan | ₹5,600/sq ft | +52% | 3.1% | — |
| Lucknow | Uttar Pradesh | ₹5,200/sq ft | +58% | 3.2% | — |
Questions
Property Markets: FAQs
Which is the most expensive city for property in India? +
Among the Indian cities we cover, Mumbai has the highest average asking price at ₹32,000/sq ft.
Which city has seen the fastest property price growth? +
Ras Al Khaimah leads our coverage with +120% over five years, followed by Gurgaon (+118%) and Goa (+105%).
Which city gives the best rental yield? +
Ras Al Khaimah has the highest average gross rental yield we track at 7%. Most large Indian cities yield 2.5–4%, so returns there rely mainly on price growth.
Which is the most affordable city you cover? +
Lucknow has the lowest average asking price among the Indian cities we cover, at ₹5,200/sq ft.
Where do these city averages come from? +
From PropertyNivesh's research: average asking prices across the localities and projects we follow in each city, not registered sale prices. Each city page shows when its data was last updated.