
📈 Price tracker · Hyderabad
Kokapet Property Prices 2025
Property prices in Kokapet, Hyderabad average ₹11,000/sq ft according to our 2025 research, up 7.8% on the previous year and growing at about 18% a year since 2020. That is 12.2% above the Hyderabad average of ₹9,800/sq ft. Gross rental yields run at about 3.4%.
🗓Published·Updated·Prices as of our 2025 research·Edited by Rakesh Mahajan
Kokapet, beside Hyderabad's Financial District, has grown into the city's premium high-rise hub, with tall towers on the Neopolis layout and the Outer Ring Road minutes away.
Current average price
₹11,000/sq ft
-
1 month
Tracking since 28 Sept 2026
-
6 months
Tracking since 28 Sept 2026
-
1 year
↑ 7.8%
-
3 years
↑ 52.8%
-
5 years
↑ 129.2%
- Yearly growth since 2020
- 18%
- Vs Hyderabad average
- +12.2%
- Gross rental yield
- 3.4%
- Price-to-rent ratio
- 29x
Kokapet price trend, 2020–2025
| Year | Average price | Change on previous year |
|---|---|---|
| 2025 | ₹11,000/sq ft | +7.8% |
| 2024 | ₹10,200/sq ft | +15.9% |
| 2023 | ₹8,800/sq ft | +22.2% |
| 2022 | ₹7,200/sq ft | +28.6% |
| 2021 | ₹5,600/sq ft | +16.7% |
| 2020 | ₹4,800/sq ft | — |
The strongest year on our record was 2022 (+28.6%); the weakest was 2025 (+7.8%). Yearly figures are average asking prices across the projects and listings we track in Kokapet.
What's driving prices in Kokapet
- ▲Financial District offices next door.
- ▲Outer Ring Road access within minutes and a quick airport run via the ORR.
- ▲The Neopolis layout is planned for high-density premium development.
- ▼A large pipeline of high-rise supply completing over the next few years.
- ▼Metro Phase-2 to the Financial District is not yet built.
- ▼Premium pricing narrows the gap with more established parts of west Hyderabad.
Metro Phase-2 to the Financial District and the Neopolis build-out.
Upcoming infrastructure on our records: Metro Phase-2 to Financial District; Neopolis build-out.
Price by project in Kokapet
| Project | Current price | Vs average | 1-year change | 6-month change | Verdict |
|---|---|---|---|---|---|
| Godrej Madison Avenue Under Construction | ₹11,500/sq ft | +4.5% | +17.3% | — | Buy |
Asking prices from our research pages, not registered transaction prices. "—" means we don't yet have a price a year (or six months) back.
What a home costs in Kokapet
At the Kokapet average of ₹11,000/sq ft, before any premium for floor, view or tower.
| Home size | Price | Duty + registration | All-in cost | EMI (max loan) |
|---|---|---|---|---|
| 1,000 sq ft | ₹1.1 Cr | ₹8.3 L | ₹1.18 Cr | ₹71,595/mo |
| 1,500 sq ft | ₹1.65 Cr | ₹12.4 L | ₹1.77 Cr | ₹1,07,393/mo |
| 2,000 sq ft | ₹2.2 Cr | ₹16.5 L | ₹2.37 Cr | ₹1,43,191/mo |
| 3,000 sq ft | ₹3.3 Cr | ₹24.8 L | ₹3.55 Cr | ₹2,14,786/mo |
EMI on the largest loan RBI rules allow, at 8.5% over 20 years, before brokerage, legal and loan fees. Run your own numbers with the down payment and EMI calculators.
Kokapet rental market
Implied by the average price and a 3.4% gross yield. At that yield a home here costs about 29 years of rent.
-
1,000 sq ft
~₹31,000/month
-
1,500 sq ft
~₹47,000/month
-
2,000 sq ft
~₹62,500/month
Implied from the average price and gross yield — actual rents vary by project, floor and furnishing. Compare owning and renting with the buy vs rent calculator.
What this means for a buyer
Look at tower density and handover dates — many large projects will complete in the same window, which affects rents at possession.
Latest news affecting Kokapet prices
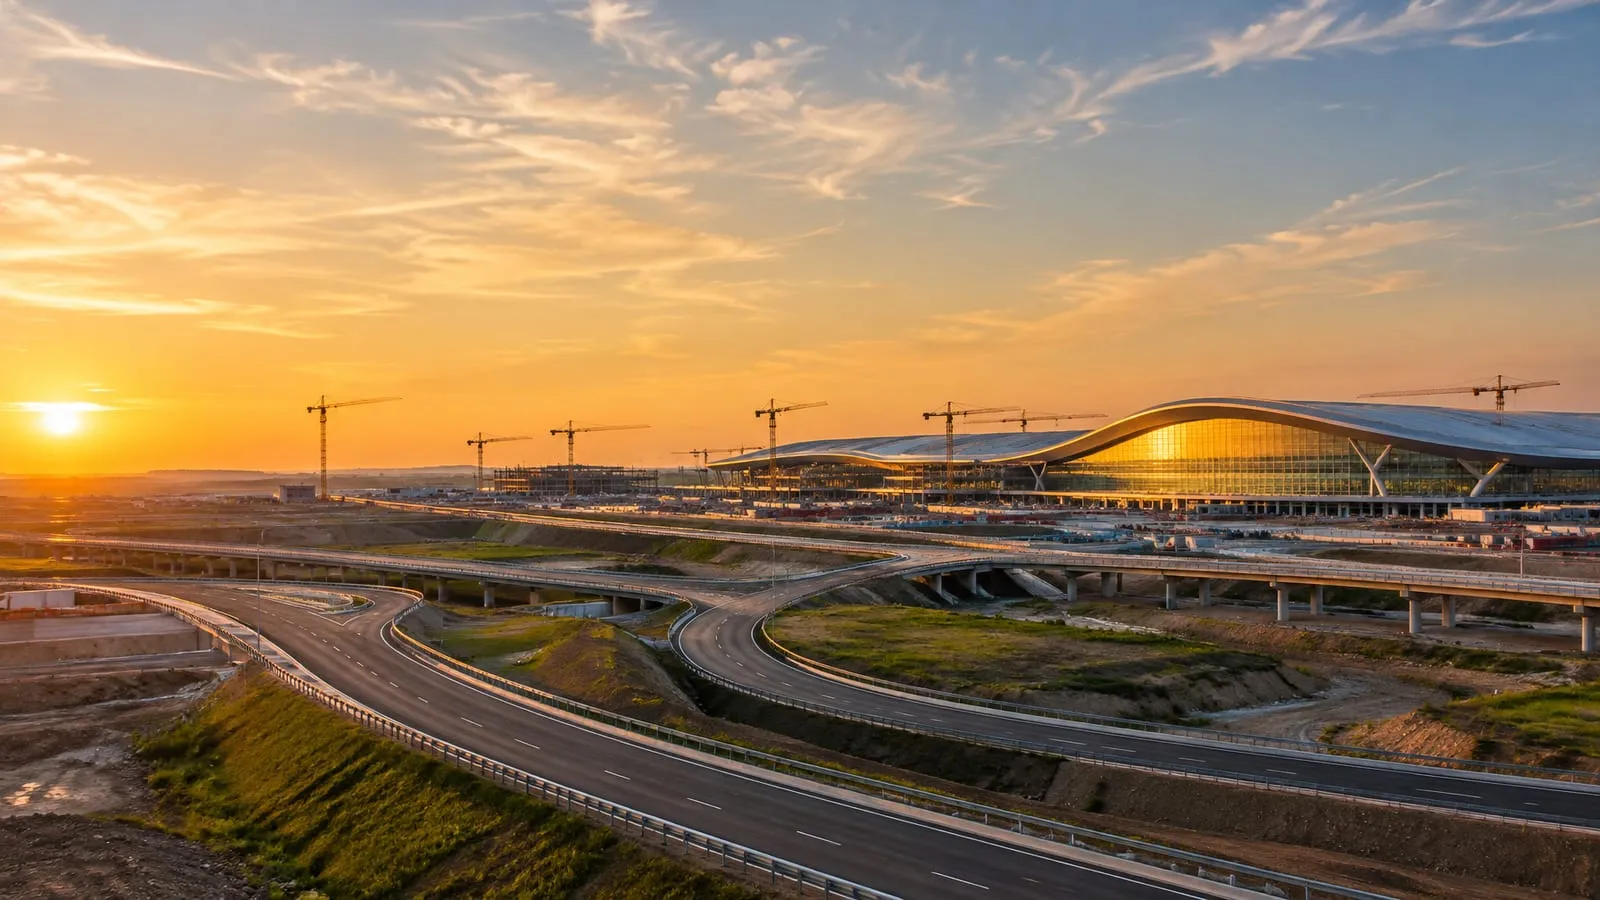
NH-44 Work in Balamrai: What It Means for Buyers and Owners in Hyderabad
Telangana Today reported that the old Balamrai reservoir has been removed to make space for the NH-44 elevated corridor work. For nearby buyers and owners, the bigger issue is not the demolition itself but the chance of changing access, construction disruption and future water-system transition.
Hyderabad Metro Sale Deadline Extended: What It Means for Buyers and Investors in Hyderabad
The Metro stake sale has been pushed to December 31 again, so the ownership question is still open. For Hyderabad’s corridor housing market, that means uncertainty around sentiment, demand and project planning continues for now.
Kokapet property prices: FAQs
What is the current property rate in Kokapet? +
The average asking price in Kokapet, Hyderabad is ₹11,000/sq ft in our 2025 research. Godrej Madison Avenue, the project we research there, is priced at ₹11,500/sq ft.
How much have property prices in Kokapet increased? +
Prices rose from ₹4,800/sq ft in 2020 to ₹11,000/sq ft in 2025, a 129.2% rise over five years (about 18% a year). The latest one-year change is +7.8%.
Is Kokapet a good place to buy property? +
It depends on what you need. In its favour: financial District offices next door. Against it: a large pipeline of high-rise supply completing over the next few years. With a gross yield of about 3.4%, most of the return here has to come from price growth. Our verdict on individual projects is on each research page.
What rent can I expect in Kokapet? +
At the average price and a 3.4% gross yield, a 1,500 sq ft home implies rent of roughly ₹47,000 a month and a 2,000 sq ft home about ₹62,500. Actual rents vary with the project, floor and furnishing.
How much does a 3BHK cost in Kokapet? +
A 1,500–2,000 sq ft home at the Kokapet average of ₹11,000/sq ft costs about ₹165 L to ₹220 L, plus roughly ₹12 L–₹17 L in stamp duty and registration in Telangana. Premium towers can cost much more per sq ft than the average.
Where do these Kokapet prices come from? +
They are average asking prices from PropertyNivesh's own locality and project research, updated when our research is refreshed — not registered sale prices. Always check recent registered transactions and the circle rate before you agree a price.
How we calculate these prices
The locality average is our research desk's figure for Kokapet, drawn from the projects and listings we follow there; the yearly history is the same figure recorded each year. One-, three- and five-year changes compare the current average with the same point that many years earlier. Project prices are the asking prices on our research pages. Monthly and six-month changes come from our own snapshots, which began 28 Sept 2026, and show "—" until the record covers that span. None of these are registered transaction prices.